Data-center sustainability is no longer only a facilities question. Storage architecture influences how much hardware must be manufactured, how much electricity and cooling a site needs, how much floor space remains available, and how often equipment is replaced.
Demand makes those choices more urgent. The International Energy Agency projects global data-center electricity consumption to reach about 945 TWh in 2030 in its base case—more than double the level used in its 2024 baseline. Storage is not the only contributor, but every unnecessary copy, oversized performance tier and underused device adds to the load.
The practical goal is not to declare one storage medium universally “green.” It is to deliver the required capacity, performance, resilience and retention period with the lowest credible lifecycle impact. That requires measuring the whole system and matching each data class to the right tier.
Key Takeaways
- Measure storage at system or rack level, not by a single device’s headline power figure.
- Compare embodied carbon and operating energy per **usable terabyte over time**, not per unit purchased.
- Reserve high-performance media for workloads that need its latency and IOPS.
- Reduce unnecessary data and copies before buying more capacity.
- Extend safe service life through monitoring, maintenance, redeployment and documented end-of-life handling.
- Treat availability and data integrity as constraints. An efficiency project that increases the risk of data loss is not sustainable.
Why Device-Level Comparisons Can Mislead
A device may appear efficient on a specification sheet yet perform poorly in a complete deployment. Raw capacity is reduced by redundancy, spares, formatting, endurance reserves, snapshots and operational headroom. Enclosures, controllers, networking, power conversion and cooling add further energy use.
For that reason, procurement teams should ask a system-level question:
> How much protected, usable capacity and required performance will this architecture deliver for each unit of energy, carbon, space and cost over its expected service life?
The answer depends on the workload. A transactional database, an active AI feature store, a surveillance archive and a regulatory backup do not need the same latency, write endurance or recovery time.
Five Metrics for a More Credible Storage Assessment
1. Embodied Carbon per Usable TB-Year
Embodied carbon includes emissions associated with raw materials, component manufacturing, assembly and transport before the equipment begins normal operation. A high-capacity device can reduce the number of units needed, but capacity alone is not enough; usable capacity and service life matter too.
A useful planning metric is:
Embodied carbon intensity = product embodied carbon (kg CO2e) ÷ usable capacity (TB) ÷ expected service life (years)
Use supplier product carbon-footprint or lifecycle-assessment documents when available. Record their boundaries, allocation method, manufacturing geography and verification status. Do not combine figures with different boundaries as if they were directly comparable.
2. Operational Energy per Usable TB
Measure energy in idle and active states under a workload that resembles production. The international standard ISO/IEC 24091:2019 defines methods for assessing storage power efficiency in both active and idle operation. Standardized testing is useful because an archive that is mostly idle should not be judged by the same profile as an I/O-intensive system.
Track at least:
- average and peak storage-system power;
- annual storage IT energy in kWh;
- average protected usable capacity;
- kWh per usable TB-year;
- performance delivered per watt for latency-sensitive tiers; and
- energy used by supporting controllers, enclosures and networking.
PUE can help estimate associated facility overhead:
Estimated facility energy attributable to storage = storage IT energy × site PUE
This is a planning approximation. PUE is a facility metric, not a storage-product score, and it does not by itself describe water use, grid carbon intensity or useful computing work.
3. Capacity Efficiency
Installed raw capacity is not the same as usable capacity. Document the effects of protection schemes, sparing, overprovisioning, snapshots and free-space policies.
Capacity efficiency = protected usable capacity ÷ installed raw capacity
Deduplication and compression can improve the ratio for suitable data, but savings are workload-dependent. Measure with a representative data set rather than relying on a maximum marketing claim.
4. Service Life and Reliability
Replacing equipment too early repeats manufacturing, transport and commissioning impacts. Keeping equipment too long without monitoring can increase failure and recovery risk. A responsible lifecycle plan therefore combines health telemetry, error trends, thermal history, workload suitability, firmware governance, spare availability and tested recovery procedures.
Expected service life should be an evidence-based planning input, not a promise. Reassess it as operating conditions and failure data change.
5. Circularity and End-of-Life Control
The world generated 62 million tonnes of e-waste in 2022, according to the Global E-waste Monitor 2024. Storage equipment also carries a special requirement: data must remain protected during reuse, resale, return and recycling.
A circular storage process should define:
- whether a device can be redeployed to a less demanding tier;
- approved data-sanitization and verification procedures;
- chain-of-custody records;
- repair and component-harvesting rules;
- take-back or certified recycling routes; and
- evidence of final disposition.
Physical destruction should not be the automatic answer for every retired device. Where policy permits, verified sanitization can preserve reuse value and delay e-waste. Where destruction is required, it should be documented and handled through an approved channel.
HDD or SSD: Which Is More Sustainable?
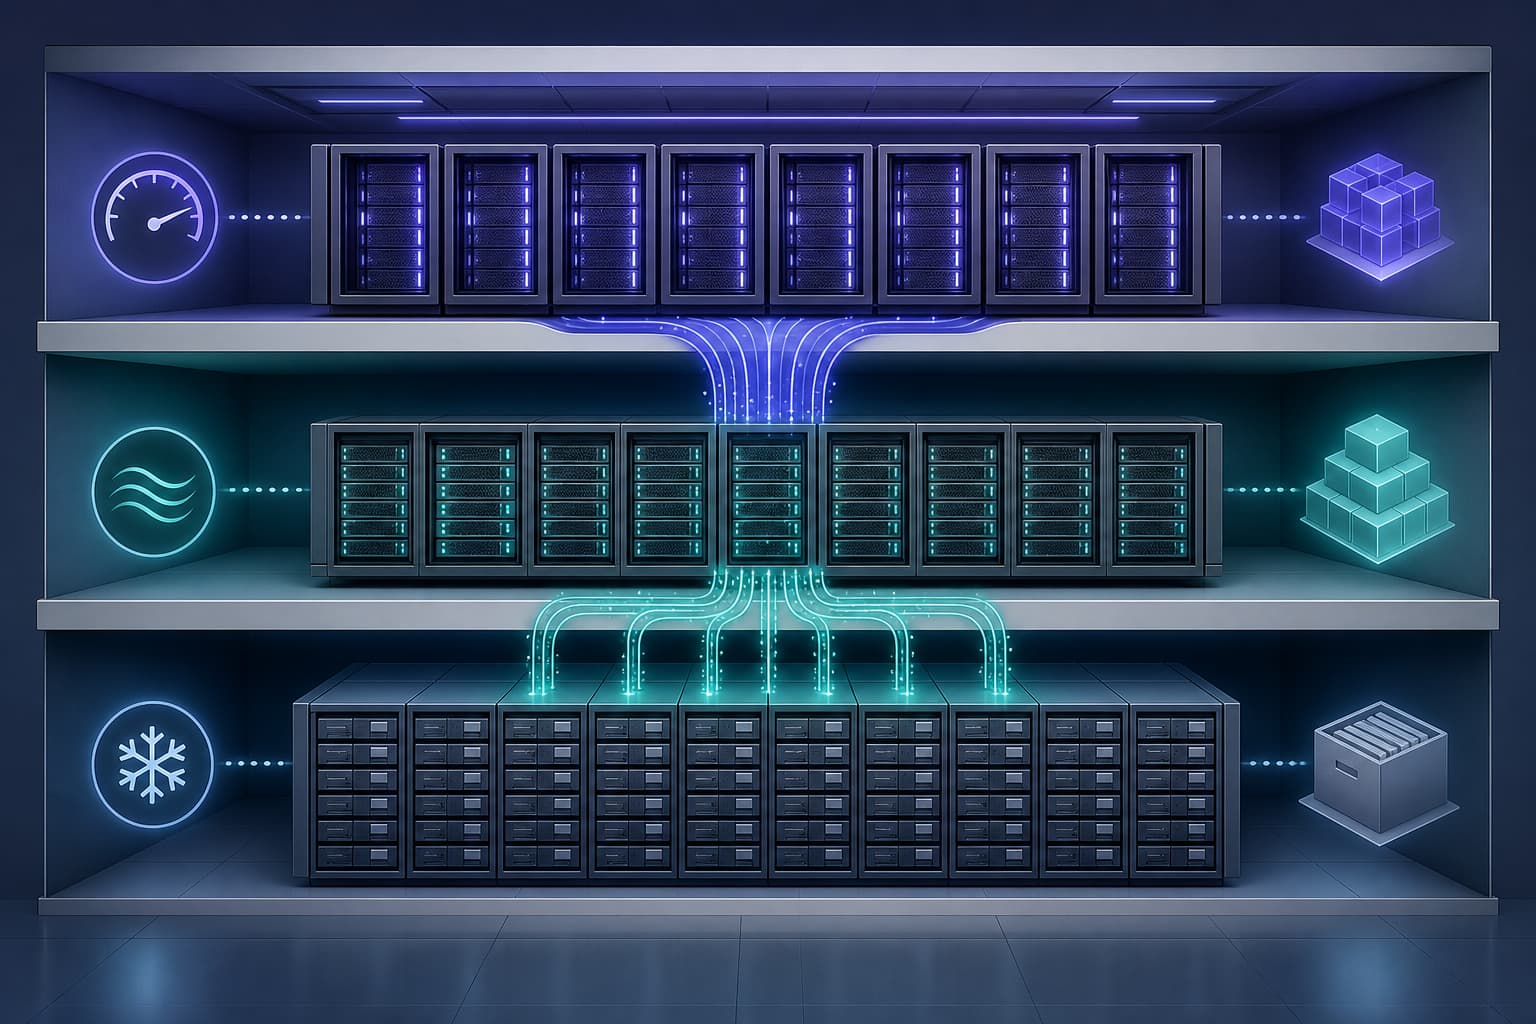
Neither technology is the right answer for every workload. The sustainable choice is the medium—or combination of media—that meets the service objective with the lowest measured lifecycle burden.
| Workload need |
Likely design direction |
Why |
Risk to check |
| Very low latency, high random I/O |
Performance-oriented solid-state tier |
High IOPS and low latency can reduce the number of devices needed for a performance target |
Endurance reserve, thermal behavior, idle power and embodied carbon |
| Large online data sets with moderate access |
Capacity-oriented hard-drive tier |
High capacity per device can reduce device count, rack space and supporting hardware |
Rebuild time, vibration, workload fit and access latency |
| Infrequently accessed retention data |
Capacity tier or offline/nearline archive |
Avoids paying continuous performance and energy costs for data that rarely moves |
Recovery-time objective, media integrity checks and migration plan |
| Mixed workloads |
Policy-driven hybrid tiering |
Places data according to business value and access pattern |
Tiering errors, duplicate copies and operational complexity |
Research on storage embodied carbon has highlighted the manufacturing intensity of flash-based storage, while other workloads can use solid-state performance to consolidate systems or finish work faster. These findings should guide questions, not replace a deployment-specific calculation.
A Seven-Step Sustainable Storage Plan
Step 1: Classify Data Before Classifying Hardware
Create data classes based on access frequency, latency, throughput, retention, legal hold, recovery-point objective and recovery-time objective. “Hot,” “warm” and “archive” are useful labels only when each has measurable rules.
Step 2: Establish a Baseline
Record logical data volume, physical protected capacity, growth rate, duplicate-copy factor, utilization, storage IT power, site PUE and annual equipment retirement. Use at least one representative business cycle; a short idle snapshot is not enough.
Step 3: Remove Avoidable Demand
Apply approved retention schedules, delete expired temporary data, control snapshot sprawl and identify redundant copies. Preserve legal holds and recovery requirements. Capacity avoided is usually cleaner than capacity purchased.
Step 4: Match Tiers to Service Levels
Keep the latency-sensitive working set on the performance tier. Move stable, rarely accessed data to a capacity-optimized tier. Automate placement only after validating that classification metadata and recall behavior are reliable.
Step 5: Test the Complete System
Measure active and idle power, usable capacity, sustained performance, thermal behavior and failure recovery with a representative workload. Include controllers, enclosures, switches and host overhead inside the test boundary. Standards-based methods improve comparability, but production telemetry remains essential.
Step 6: Procure for Lifecycle Value
Request energy data, environmental declarations, repair information, warranty terms, firmware support periods, sanitization guidance and take-back options. Score bids against a weighted set of service, cost and environmental requirements instead of using price per raw terabyte alone.
Step 7: Review Quarterly and at Every Capacity Event
Track kWh per usable TB-year, utilization, data growth, failure trends, carbon intensity, retired capacity and verified reuse or recycling. Recalculate before a major expansion because workload mix and grid emissions may have changed.
Composite Planning Case: A 2 PB Research and Media Repository
> Case status: This is an illustrative composite, not a customer testimonial. All figures are assumptions designed to demonstrate the method. They are not product benchmarks or guaranteed savings.
A research and media organization expects its logical repository to reach 2 PB. Its existing planning model applies a 1.6× physical-capacity factor for approved protection and working copies, implying 3.2 PB of physical capacity. The organization initially considers placing the entire repository on one high-performance tier.
Before procurement, the team performs a retention and duplication review. For the example, assume:
- 8% of logical data has passed its approved retention period and is not under legal hold;
- content-level deduplication reduces the remaining eligible data by 12%;
- the 1.6× protection-and-copy factor remains unchanged; and
- 15% of the retained logical data is hot, 35% is warm and 50% is archival.
The calculation is transparent:
Retained logical data = 2 PB × 0.92 × 0.88 = 1.619 PB
Required physical capacity = 1.619 PB × 1.6 = 2.591 PB
Under these assumptions, the organization avoids planning for about 0.609 PB of physical capacity—a 19% reduction—before choosing any new hardware. This is capacity avoidance, not a claimed carbon saving.
The team then tests a tiered design. The hot working set must pass latency and throughput targets. Warm and archive tiers are evaluated primarily on protected usable capacity, watts per usable TB, recovery behavior and lifecycle documentation. The final carbon estimate is calculated only after obtaining comparable product carbon data, measured system energy and the relevant grid-emissions factor.
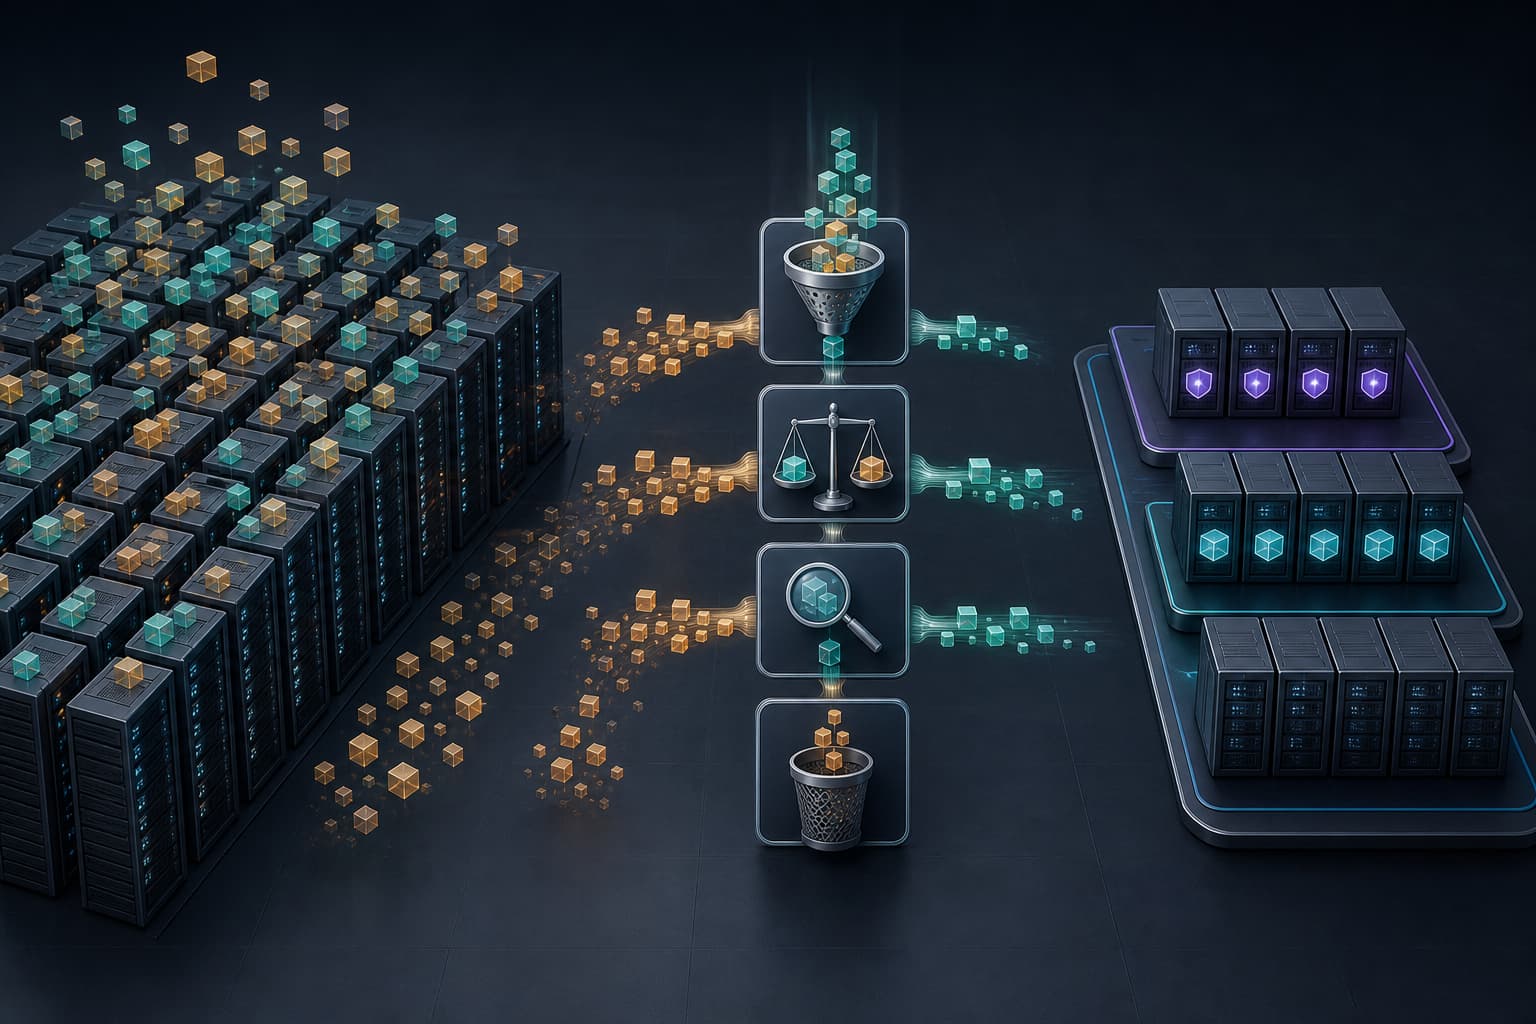
The lesson is simple: data governance and workload placement can change the procurement requirement more than a device-level comparison. The safest sustainability claim is the one that can be reconstructed from documented assumptions and measurements.
Procurement Checklist
- [ ] Are performance, resilience, retention and recovery objectives documented?
- [ ] Is capacity stated as protected usable TB, not only raw TB?
- [ ] Were idle and active energy measured with a representative workload?
- [ ] Does the boundary include controllers, enclosures and networking?
- [ ] Are embodied-carbon figures comparable in scope and independently reviewed?
- [ ] Is expected service life supported by warranty, telemetry and maintenance planning?
- [ ] Can equipment be repaired, redeployed or securely sanitized?
- [ ] Is there a documented take-back or recycling route?
- [ ] Are assumptions, test dates and responsible reviewers recorded?
Frequently Asked Questions
Is a hard drive always more sustainable than an SSD?
No. Capacity-oriented hard drives can be efficient for large, moderately accessed data sets, while solid-state storage can be the better choice when latency, IOPS or consolidation is the dominant requirement. Compare complete architectures against the same usable-capacity, performance and service-life requirements.
What is the most useful storage sustainability metric?
There is no single complete metric. A practical minimum set is embodied kg CO2e per usable TB-year, operational kWh per usable TB-year, capacity utilization, service life and verified end-of-life outcome.
Does a lower PUE mean the storage design is efficient?
Not necessarily. PUE describes facility overhead relative to IT energy. An efficient facility can still run an oversized or poorly utilized storage estate. Pair PUE with storage-level energy, capacity and workload metrics.
Can deleting data create compliance risk?
Yes. Deletion must follow approved retention schedules, legal holds, backup policy and business requirements. Sustainable data management is governed deletion, not indiscriminate deletion.
How often should a storage sustainability assessment be updated?
Review key metrics at least quarterly and repeat the full assessment before major capacity purchases, platform migrations or changes to retention and recovery requirements.
Conclusion
Sustainable data-center storage is an architecture and governance discipline, not a label attached to one medium. Start with the workload, calculate protected usable capacity, measure the complete system, and include manufacturing and end-of-life impacts. Then use tiering, data reduction, service-life extension and responsible retirement to meet business requirements with less avoidable hardware and energy.
The result is more than a smaller environmental footprint. Clear metrics also improve capacity forecasts, procurement decisions, operational resilience and total cost control.
Sources and Further Reading